 Short interest is a statistic I always check before I trade a stock. We’ve gotten a lot of questions about what it means for how you trade the stock, and how it affects your bias. Today we are going to start by defining it, and then discuss how you should make trading decisions based on it:
Short Interest Definition
The short interest is the approximate number of shares that are short a stock, meaning shares that are being used to bet on the security going down. For traders, you want to also look at the “Short % of Float” statistic to see what percent of the stock’s float is short the stock. This essentially tells you what percent all the people who own shares of the stock are short, and who are long. A stock that has more than 10% of its float short the stock is considered to have high short interest. You can get these statistics about a stock’s short interest at shortsqueeze.com and finviz.com. These statistics about a company’s short interest is typically updated 1-2 times a month.Why Short Interest Matters
A stock’s short interest by itself is not by itself considered to be an immediate buy or sell signal. You want to pair it was some technical pattern or fundamental catalyst. It is most effectively used when a stock is in play, meaning it has some type of catalyst that is bringing momentum and volume into the stock. It can support a long thesis because you know there are people who will be potentially underwater and looking to get out if the stock starts to squeeze. If you are looking to get long a stock, and you see there is a high short interest in the name, that tells you there are a lot of potential people who may look to exit their positions if the stock starts to uptrend and breakout.W Example
Wayfair Inc. is a great example of why it pays to know a company’s short interest. On February 25th it gapped up in response to a strong quarterly earnings report. We have talked about in past articles about how to know if a gap up will fade or follow through. Another factor to consider is the stock’s short interest. Look at the daily chart, and you will see how much it gapped up on the day it reported earnings: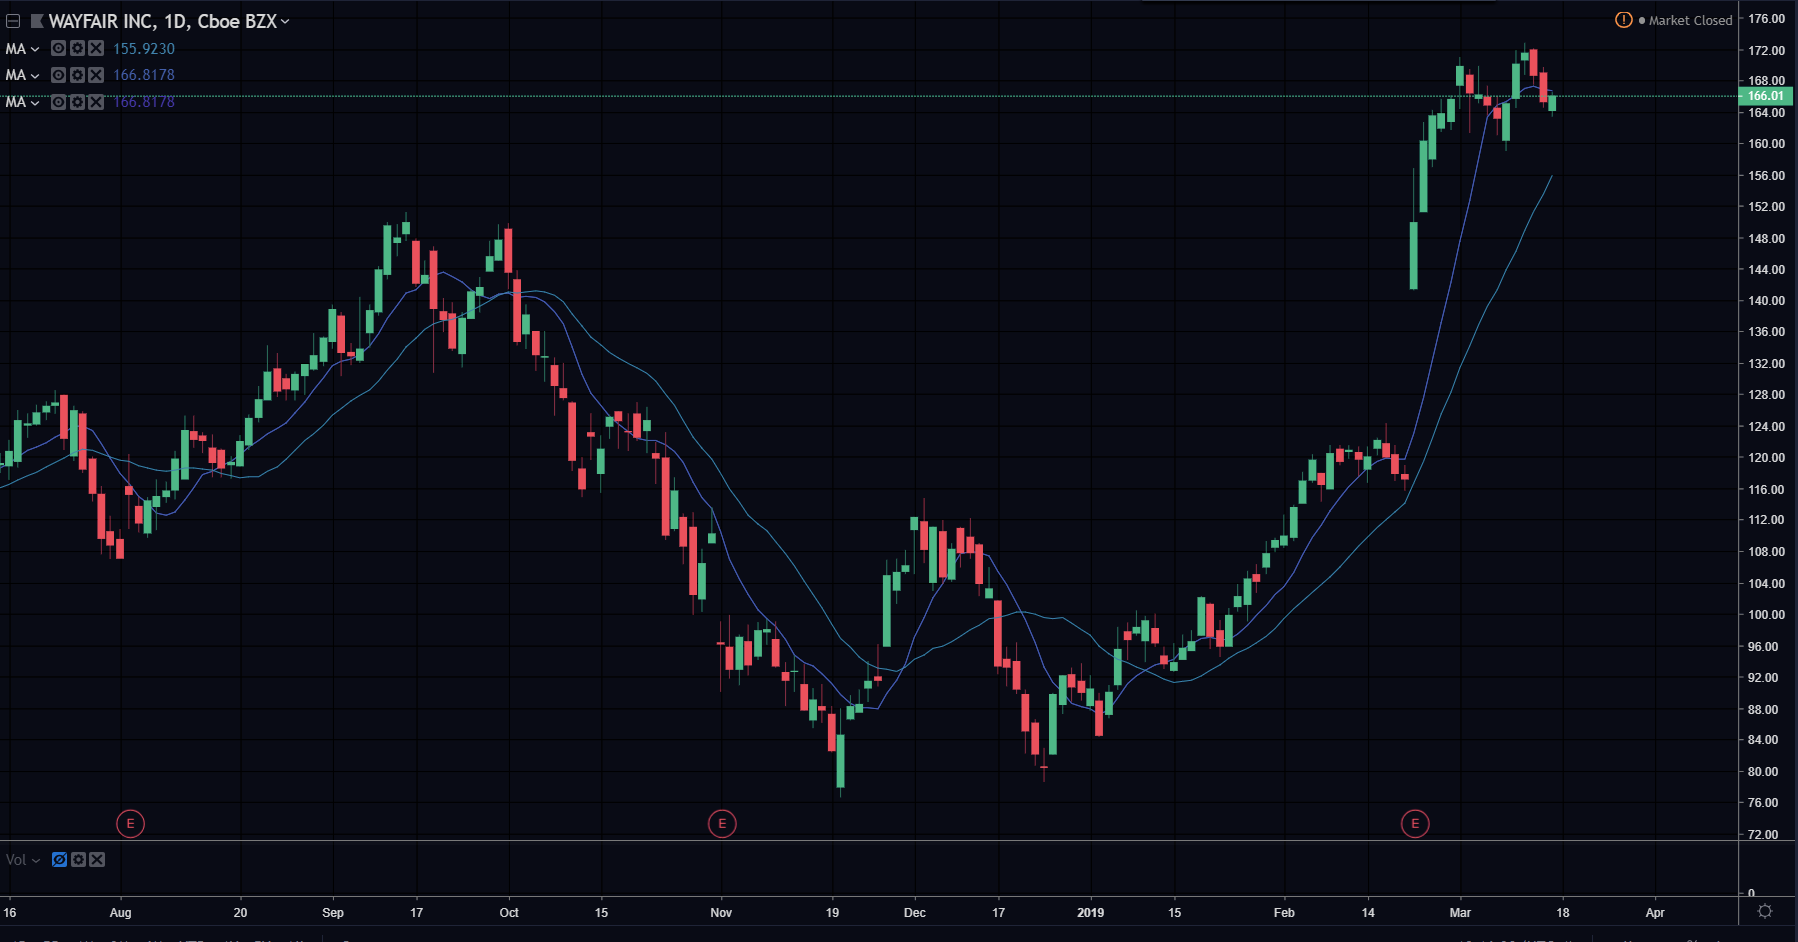 If you look at its “short percent of float”, you will see that its short interest is just over 25%. This means there were a TON of shorts who were underwater, as the stock was gapping up 20%, and is right at all-time highs. This would tell you there is high probability shorts will be looking to exit their positions when the market opens to escape further pain. This means that going into the market open, you know there is a high probability the stock will squeeze and gives you an opportunity to take a long position to capitalize.